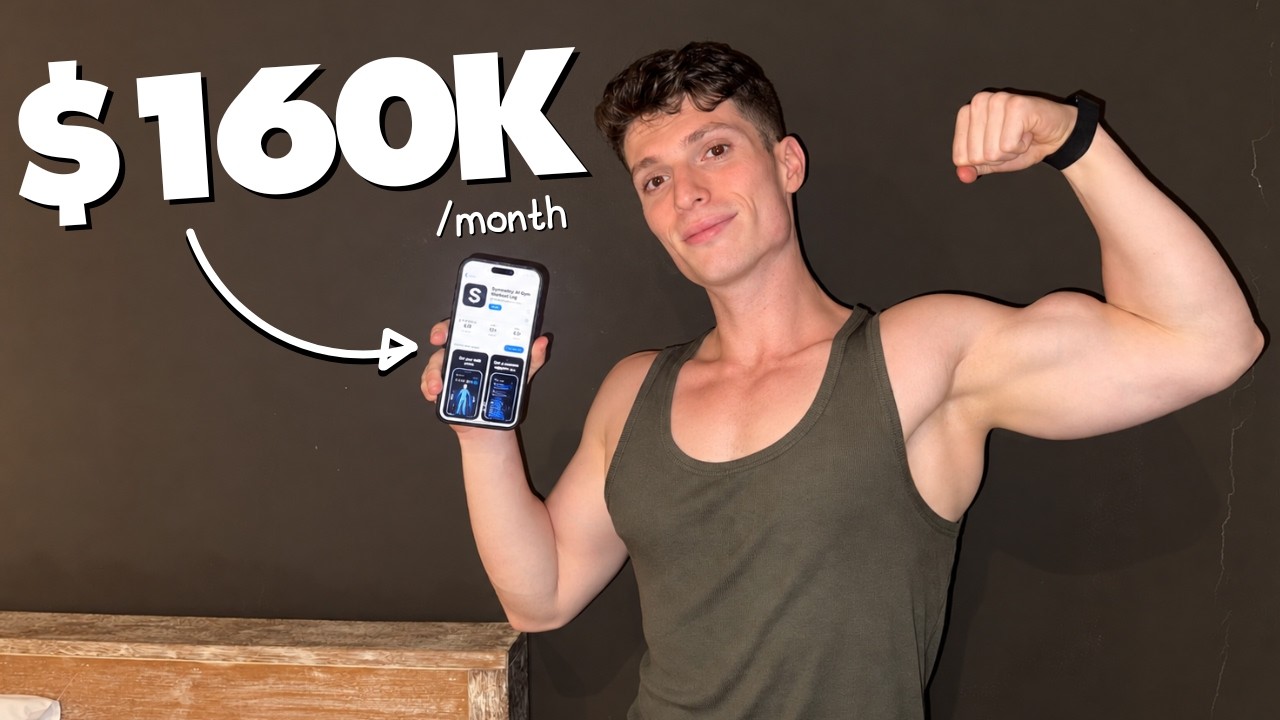
Mauro, 22, built Symmetry — a gym tracking app for the Spanish and Mexican markets — that reached $160,000 monthly revenue and 3 million downloads within one year of its June 2023 launch; the episode focuses less on the app itself and more on the systematic, experiment-driven framework Mauro uses to decide what to build.
Origin and early growth
Mauro grew up obese; the gym transformed his life, and he became a fitness YouTuber alongside his future co-founders before deciding an app could help more people at scale.
Launch spike from their YouTube audience faded quickly; summer UGC attempts stalled around 30k downloads; January 2024 brought a seasonal spike, after which growth stabilized.
UGC engine that powers acquisition
After influencer marketing failed, they doubled down on user-generated content: ~80,000 videos posted, 500+ creator accounts, nearly 8 billion views in the last year.
They segment videos into formats and sub-formats (e.g., lock-screen notification skits); one variant hit 17 million views.
Creators receive nearly 50% of revenue, aligning incentives for long-term, high-volume output.
Three-phase evolution of product philosophy
Phase 1: built what the founders wanted — “terrible idea.”
Phase 2: built exactly what users requested via feedback — “mediocre.”
Phase 3 (current): methodical, scientific approach — treat every feature as an experiment, identify high-leverage surfaces, and AB test relentlessly.
Finding high-leverage surfaces
Not all screens matter equally: dark/light mode affects ~2% of DAU; paywall changes affect nearly everyone; exercise search screen drives activation and retention; the default workout-log screen showed zero metric movement despite multiple redesigns.
The job is to discover which surfaces actually move core metrics and concentrate experiments there.
OKR-driven direction and metric selection
Quarterly OKRs set ambitious targets; earlier-stage products should set more aggressive goals because percentage gains are easier when the base is small.
Team reviews metrics daily or weekly in a “warm-up” dashboard covering marketing, product, and guardrail metrics.
For a gym tracker, activation (getting a user to log a real workout) is the critical leading indicator; moving it pulls retention and revenue.
Core metrics tracked: downloads (top of funnel), activation, first-week and 30-day retention, ARPU (average revenue per user) by country — ARPU determines affordable creator payouts.
Most common mistake: no event tracking at all. Instrument every screen, especially onboarding, with granular funnels to see where drop-off happens.
Quantitative data (Posthog funnels) reveals the what; qualitative data (user interviews, Discord, Reddit) reveals the why.
Both are required: analytics point to the problem area; conversations explain the underlying friction.
AB testing as a disciplined loop
Start from problem space, not solution space: define the problem, verify it’s real, then generate multiple hypotheses.
For each hypothesis: estimate metric impact, identify guardrail metrics, design experiment, run control vs. variant(s) for minimum two weeks, then analyze.
Experiment velocity tracked in Notion (“Evelyn” database): user interview → hypothesis → experiment → Posthog results.
Concrete example: redesigning the post-onboarding workout log screen (two variants) moved no metrics — signal to stop investing there.
Another example: adding a single commitment screen at onboarding end (“I will work out”) lifted 3-day retention by 3% — a tiny change with outsized impact.
Tech stack
Development: Claude with MCPs connected to analytics and revenue tools.
Voice coding: WhisperFlow for faster input.
AB testing: Posthog (general), Superwall (paywall-specific).